
Minnesota Administrative Rules
CHAPTER 8106, RAILROAD VALUATION
DEPARTMENT OF REVENUE
PROPERTY EQUALIZATION
| Part | Title |
|---|---|
| 8106.0100 | DEFINITIONS. |
| 8106.0200 | [Repealed, L 2003 c 127 art 5 s 50] |
| 8106.0300 | REPORTS REQUIRED. |
| 8106.0400 | VALUATION. |
| 8106.0500 | ALLOCATION. |
| 8106.0600 | ADJUSTMENTS FOR NONFORMULA ASSESSED PROPERTY OR EXEMPT PROPERTY. |
| 8106.0700 | APPORTIONMENT. |
| 8106.0800 | EQUALIZATION. |
| 8106.9900 | EXAMPLE OF APPORTIONMENT PROCESS. |
8106.0100 DEFINITIONS.
Subpart 1.
Scope.
As used in this chapter, the following words, terms, and phrases have the meanings given to them by this part. Some of the words, terms, and phrases are defined by statute but are included here for completeness.
Subp. 2.
Allocation.
"Allocation" means the process by which a fair and reasonable portion of each railroad's total unit value is assigned to Minnesota for purposes of taxation.
Subp. 3.
Apportionment.
"Apportionment" means the process of distributing that portion of the railroad's unit value which has been allocated to Minnesota after deducting exempt and nonoperating property to the various counties and taxing districts in which the railroad company operates.
Subp. 4.
Assessment/sales ratio.
"Assessment/sales ratio" means the ratio derived by dividing the estimated market value of a property by its adjusted selling price and used as a measure of the level of estimated market value to real or true market value.
Subp. 5.
Book depreciation.
"Book depreciation" means the depreciation shown by a railroad company on its corporate books and allowed the company by the Surface Transportation Board.
Subp. 6.
Capitalization rate.
"Capitalization rate" means an anticipated rate of return from an investment, a rate at which income is processed (capitalized) to indicate the probable capital value. This rate is usually expressed as a percentage.
Subp. 7.
Equalization.
"Equalization" means the adjustment of the estimated market value of railroad operating property to the apparent assessment/sales ratio of commercial and industrial property.
Subp. 8.
Exempt property.
"Exempt property" means property which is nontaxable for ad valorem tax purposes by statutes. An example of such property is personal property exempt from taxation under Minnesota Statutes, chapter 272.
Subp. 10.
Mainline track.
"Mainline track" means all track reported to the STB by the respondent railroad as main line.
Subp. 12.
Obsolescence allowance.
"Obsolescence allowance" means the adjustment to be made to the gross cost indicator of value to reflect the loss of economic usefulness or value because of causes other than physical deterioration.
Subp. 13.
Operating property.
"Operating property" means all property owned or used on a regular and continual basis by a railroad company in the performance of railroad transportation services, including without limitation, franchises, rights-of-way, bridges, trestles, shops, docks, wharves, buildings, and structures.
Subp. 14.
Original cost.
"Original cost" means the amount paid for an asset as recorded on the railroad's books in accordance with STB accounting rules and regulations.
Subp. 17.
Restated cost.
"Restated cost" means the cost of an asset recorded on a railroad's books after adjusting the amount from a retirement-replacement-betterment accounting basis to a depreciation accounting basis, in accordance with Code of Federal Regulations, title 49, part 1201 (effective January 1, 1983).
Subp. 18.
Structure.
"Structure" means all coal and ore wharves or docks, station houses, depots, shops, office buildings, and all other buildings with a restated cost of over $10,000.
Subp. 19.
System.
"System" means the total tangible property, real and personal, of a company which is used in its railroad operations in all states in which it operates.
Subp. 20.
Unit value.
"Unit value" means the value of the system of a railroad company taken as a whole without any regard to the value of its component parts.
Subp. 21.
Weighting.
"Weighting" means the confidence or reliability given to a factor or indicator. It is usually expressed as a portion of 100 percent.
History:
11 SR 335; L 2003 c 127 art 5 s 50; 28 SR 1297; L 2005 c 151 art 1 s 114
Published Electronically:
November 14, 2006
8106.0200
[Repealed, L 2003 c 127 art 5 s 50]
Published Electronically:
November 14, 2006
8106.0300 REPORTS REQUIRED.
Subpart 1.
Reports to be filed.
The data used in the valuation, allocation, and apportionment processes will be drawn from reports submitted to the Department of Revenue by the railroad companies. These reports shall include:
D.
other commonly accepted sources of railroad income, expense, capitalization, and debt and stock values such as IBBOTSON Associates Inc., and Statistics of Class I Freight Railroads compiled by the STB.
Subp. 3.
Failure to file.
In the event any railroad company fails to file the required reports, the commissioner shall make a valuation according to the commissioner's best judgment based on available information.
Other sources of pertinent information may be consulted only when necessary to make the valuation, allocation, and apportionment required by parts 8106.0100 to 8106.0700. Said sources will, when applicable, be used uniformly and will be commonly accepted sources of data for which they are consulted. Questions unique to the valuation of a particular railroad may be resolved by consulting the books and records of the particular railroad involved.
History:
11 SR 335; 28 SR 1297; L 2005 c 151 art 1 s 114
Published Electronically:
November 14, 2006
8106.0400 VALUATION.
Subpart 1.
In general.
The approaches to value that will be used in determining the estimated unit value of railroad operating property are cost, capitalized income, and stock and debt except as provided in subparts 4 and 6.
Subp. 2.
Cost approach to valuation.
The cost factor that will be considered in the railroad valuation method is the restated cost of the railroad system, plus the restated cost of construction work in progress on the assessment date. The railroad system shall be considered to be made up of the following STB accounts: all road and equipment accounts, including leased equipment accounts; all general expenditures; and other elements of investment and railroad property owned and leased to others as well as railroad property leased from others. Book depreciation and obsolescence shall be allowed as a deduction from the restated cost of the railroad's assets enumerated above. The original cost if known, and the annual lease payments of any leased operating property used by the railroad must be reported to the commissioner in conjunction with the annual railroad report. The commissioner shall incorporate the value of the leased property into the railroad's unit value utilizing this information.
Obsolescence will be calculated through the use of the "Blue Chip Method." This method compares the railroad being appraised with the best railroads in the country, the so-called blue chip railroads. Three indicators of obsolescence will be used. First, a five-year average rate of return will be calculated for the railroad under appraisal. This rate of return is computed by dividing the subject's annual net railroad operating income for each of the most recent five years preceding the assessment, by the railroad's total owned transportation property less recorded depreciation and amortization (net investment in railroad property) for each corresponding year. The resulting five rates of return are then averaged using a simple arithmetic average to arrive at a five-year average rate of return. An example of this computation is as follows:
XYZ Railroad
| Year | Net Railroad Operating Income | Net Investment | Indicated Rate of Return |
| .... | $2,700,000 | $31,500,000 | 8.57% |
| .... | $2,900,000 | $32,000,000 | 9.06% |
| .... | $3,100,000 | $33,500,000 | 9.25% |
| .... | $3,300,000 | $34,000,000 | 9.70% |
| .... | $3,530,700 | $35,000,000 | 10.08% |
| Total 46.66% | |||
| Five-year Average Rate of Return | 9.33% | ||
A study will then be made of the Class I railroads operating within the United States for the same five-year period using such informational sources as information compiled annually by the Wisconsin Department of Revenue known as the "Blue Chip" Obsolescence Study for STB Class I Railroads. Each year the railroad with the highest rate of return will be selected as the blue chip railroad. The resulting five rates of return will then be averaged to find the five-year average blue chip rate of return. An example of this process is as follows:
| Year | Railroad | Rate of Return |
| .... | ABC | 11.50% |
| .... | FGH | 11.27% |
| .... | JKL | 10.57% |
| .... | MNO | 11.02% |
| .... | XYZ | 10.08% |
| Total 54.44% | ||
| Five-year Average Blue Chip Rate of Return | 10.89% | |
The five-year average rate of return for the railroad under appraisal will be compared to the five-year average blue chip rate of return. The deviation of the subject railroad's rate of return from the blue chip railroads' rate of return is the amount of indicated obsolescence. The following example illustrates the computation.
| XYZ Railroad Five-Year Average Rate of Return | 9.33% |
| Blue Chip Five-Year Average Rate of Return | 10.89% |
| Indicated Obsolescence 1 - (9.33% ÷ 10.89%) | 14.30% |
Second, a five-year average freight traffic density indicator will be calculated. This indicator is calculated by dividing the subject railroad's ton miles of revenue freight for the most recent five years preceding the assessment by the average miles of road operated for each corresponding year. The resulting five indicators of freight traffic density are then averaged using a simple arithmetic average to arrive at a five-year average of freight traffic density. An example of this computation is as follows:
XYZ Railroad
| Year | Ton Miles of Revenue Freight | Average Miles of Road Operated | Indicated Freight Traffic Density |
| .... | 1,300,000,000 | 575 | 2,260,000 |
| .... | 1,402,500,000 | 550 | 2,550,000 |
| .... | 1,200,000,000 | 550 | 2,180,000 |
| .... | 1,100,000,000 | 500 | 2,200,000 |
| .... | 1,000,000,000 | 500 | 2,000,000 |
| Total 11,190,000 | |||
| Five-Year Average Freight Traffic Density | 2,238,000 | ||
A five-year study is then made of the Class I railroads operating within the United States in the same manner and using the same sources as the rate of return study with the exception that this study concentrates on the freight traffic density achieved by the various Class I railroads. Each year the railroad with the highest freight traffic density will be selected as the blue chip railroad. The resulting five freight traffic density amounts will then be averaged to find the five-year average blue chip freight traffic density amount. An example of this process is as follows:
| Year | Railroad | Freight Traffic Density |
| .... | JKL | 2,280,000 |
| .... | FGH | 2,600,000 |
| .... | FGH | 2,200,000 |
| .... | MNO | 2,900,000 |
| .... | ABC | 2,280,000 |
| Total 12,260,000 | ||
| Five-year Average Blue Chip Freight Traffic Density | 2,452,000 | |
The five-year average freight traffic density indicator of the railroad under appraisal will be compared to the five-year average blue chip freight traffic density indicator. The deviation of the subject railroad's freight traffic density from the blue chip railroad's freight traffic density is the amount of indicated obsolescence. The following example illustrates this computation:
| XYZ Railroad Five-Year Average Freight Traffic Density | 2,238,000 |
| Blue Chip Five-Year Average Freight Traffic Density | 2,452,000 |
| Indicated Obsolescence 1 - (2,238,000 ÷ 2,452,000) | 8.70% |
Third, a five-year average gross profit margin indicator will be calculated. This indicator measures a railroad's ability to convert gross revenue to net profit. This indicator is calculated by dividing net railway operating income, before federal and deferred taxes, by gross revenues. This calculation is performed using the subject railroad income figures for the most recent five years preceding the assessment. The resulting five indicators of gross profit margin are then averaged using a simple arithmetic average to arrive at a five-year average of gross profit margin. An example of this computation is as follows:
XYZ Railroad
| Year | Net Railroad Operating Income Before Taxes |
Gross Revenue | Indicated Gross Profit Margin |
| .... | 4,050,000 | 15,000,000 | 27.0% |
| .... | 4,350,000 | 15,800,000 | 27.5% |
| .... | 4,650,000 | 16,500,000 | 28.2% |
| .... | 4,950,000 | 17,300,000 | 28.6% |
| .... | 5,295,000 | 19,000,000 | 27.9% |
| Total 139.2% | |||
| Five-Year Average Gross Profit Margin | 27.8% | ||
A study will then be made of the Class I railroads operating within the United States for the same five-year period in the same manner and using the same sources in the two previous five-year studies mentioned above. This study will look at the gross profit margin achieved by the various Class I railroads. Each year the railroad with the highest gross profit margin will be selected as the blue chip railroad. The resulting five gross profit margin percents will then be averaged to find a five-year average blue chip gross profit margin percentage. An example of this process is as follows:
| Year | Railroad | Gross Profit Margin |
| .... | ABC | 30.0% |
| .... | ABC | 31.2% |
| .... | JKL | 29.9% |
| .... | FGH | 32.6% |
| .... | JKL | 33.3% |
| Total 157.0% | ||
| Five-Year Average Blue Chip Gross Profit Margin | 31.4% | |
The five-year average gross profit margin percent for the railroad under appraisal will be compared to the five-year average blue chip gross profit margin percent. The deviation of the subject railroad's gross profit margin from the blue chip railroad's gross profit margin is the amount of indicated obsolescence. The following example illustrates this computation:
| XYZ Railroad Five-Year Average Gross Profit Margin | 27.8% |
| Blue Chip Five-Year Average Gross Profit Margin | 31.4% |
| Indicated Obsolescence 1 - (27.8% ÷ 31.4%) | 11.5% |
The obsolescence percentage indicated by this comparison of gross profit margins will be added to the obsolescence indicated by a comparison of rates of return and freight traffic density. The total of these three amounts will be averaged and this result will be the overall obsolescence percentage for the subject railroad. The following is an example of this computation:
XYZ Railroad
| Obsolescence Indicated by Rate of Return Comparison | 14.30% |
| Obsolescence Indicated by Freight Traffic Density Comparison | 8.70% |
| Obsolescence Indicated by Gross Profit Margin Comparison | 11.50% |
| Total 34.50% | |
| Average Obsolescence Percentage | 11.50% |
The obsolescence percentage will then be applied to the road accounts of the subject railroad, excluding land and personal property, after the allowance for depreciation has been deducted. In no instance shall the allowance for obsolescence exceed 50 percent. The following example illustrates how the cost indicator of value is computed and how the allowance for obsolescence is applied.
XYZ Railroad
| Account | Amount | |
| Road | $24,000,000 | |
| Equipment -- Owned and Leased | 9,000,000 | |
| Construction Work in Progress | 4,500,000 | |
| General Expenditures | 1,823,000 | |
| Gross Cost Indicator | 39,323,000 | |
| Less Depreciation | 10,000,000 | |
| Net Cost Indicator | $29,323,000 | |
| Road | $24,000,000 | |
| Less Land and Personal Property | 1,000,000 | |
| Adjusted Road | 23,000,000 | |
| Adjusted Road | $23,000,000 | |
| Depreciation on Adjusted Road | 7,000,000 | |
| Net Road | 16,000,000 | |
| Obsolescence Percent | 11.5% | |
| Obsolescence Amount | 1,840,000 | |
| Adjusted Cost Indicator of Value | $27,483,000 | |
This cost indicator of value computed in accordance with this part will bear a weighting of 15 percent of the total unit value estimate of the railroad's property, except in the case of bankrupt railroads, or railroads with no income to be capitalized, as provided for in subpart 6, or railroads not meeting the criteria for use of the stock and debt approach to value as specified in subpart 4. These railroads will be valued using a 40 percent weighting for the cost indicator of value.
Subp. 3.
Income approach to valuation.
The income indicator of value will be calculated by averaging the net railway operating income, as defined by the STB, of the railroad for the most recent five years preceding the assessment. This average income shall be capitalized by applying to it a capitalization rate which will be computed by using the band of investment method. This method will consider:
D.
the yield on common stock of railroads.
This rate will be calculated each year using the method described in this subpart.
An example of a computation of the capitalized income approach to value is as follows:
XYZ Railroad
| Year | Net Railway Operating Income |
| .... | $ 2,600,000 |
| .... | 2,700,000 |
| .... | 3,000,000 |
| .... | 3,100,000 |
| .... | 3,492,500 |
| Total | $14,892,500 |
| Average | $ 2,978,500 |
Five-year average Net Railway Operating Income Capitalized at 14.0 percent (2,978,500 ÷ 14.0 percent) equals $21,275,000.
The income indicator of value computed in accordance with this part shall be weighted 60 percent of the total estimated unit value of the railroad's property except in the case of bankrupt railroads or railroads having no net operating income as provided for in subpart 6.
Subp. 4.
Stock and debt approach to valuation.
The stock and debt approach to value is the third method which will be used to estimate the unit value of the railroad operating property. This approach to value is based on the accounting principle: assets = liabilities + equity. Therefore, when the value of a company's liabilities (debt) is found and this added to the worth of its stock, a value can be established for its assets (property).
The use of this approach to value will be limited to only those railroads meeting qualifications in items A to C:
B.
The bonds of the railroad must be traded or have a rating by either Standard and Poor's or Moody's rating services.
C.
If the railroad is part of a diversified company, the value of the railroad portion of the total stock price must be able to be separated on an earnings basis using the following method:
XYZ Railroad
| XYZ railroad is wholly owned by ABC Industries Inc. | |
| Net Earnings of ABC Industries | $5,200,500 |
| Net Earnings of XYZ Railroad | $2,600,250 |
| Percent of XYZ net earnings to total conglomerate earnings | 50% |
| Value of share of ABC Industries stock | $100 |
| XYZ Railroad portion of stock value | $50 |
If a railroad has no net earnings, and is part of a conglomerate, then the stock and debt indicator of value will not be used.
The value of the stock used in the stock and debt method shall be an average of the month-ending stock prices for the 12 months immediately preceding the assessment date of January 2. The value of the bonds, equipment obligations, and conditional sales contracts, and other long-term debts shall also be an average of the cost of money quotes for the 12 months immediately preceding the assessment date of January 2. The source for these stock and bond prices shall be Standard and Poor's Stock Guide or other applicable financial service.
An illustration of a computation of the stock and debt approach to value is as follows:
XYZ Railroad Company
| Shares of Common Stock issued x | |
| Average price for preceding year | |
| 1,000,000 x $12 = $12,000,000 | |
| Shares of Preferred Stock x | |
| Average price for preceding year | |
| 100,000 x $15 = $ 1,500,000 | |
| Rate and face value of bonds x | |
| Average price for class of bonds for preceding year | |
| A rated 8% bonds $10,000,000 x 99% of par = $ 9,900,000 | |
| Stock and Debt Indicator of Value | $23,400,000 |
After the gross stock and debt indicator of value has been computed, an allowance will be made for the effect, if any, of revenue from other than railway operations included in this indicator of value. This allowance shall be based on the ratio of a five-year average of net revenue from railway operations, as determined by the STB, to a similar five-year average of income available for fixed charges as determined by the STB. The five-year average will be the most recent five years preceding the assessment date. An example of this computation is as follows:
XYZ Railroad Company
| Year | Net Revenue from Railway Operations |
Income Available for Fixed Charges |
| .... | $ 3,000,000 | $ 3,500,000 |
| .... | 4,000,000 | 4,300,000 |
| .... | 5,200,000 | 5,700,000 |
| .... | 6,000,000 | 6,800,000 |
| .... | 5,200,000 | 5,400,000 |
| $23,400,000 | $25,700,000 | |
| Average | $ 4,680,000 | $ 5,140,000 |
| Ratio $4,680,000 ÷ $5,140,000 = 91% | ||
| Gross Stock and Debt Indicator of Value | $23,400,000 | |
| Ratio of Operating to Noncarrier Earnings | 91% | |
| Net Stock and Debt Indicator of Value | $21,300,000 | |
The stock and debt indicator of value computed in accordance with this part will bear a weighting of 25 percent of the total unit value of the railroad's property, except in the case of bankrupt railroads, railroads in bankruptcy proceedings, or railroads with no income to be capitalized, as provided for in subpart 6. If no stock and debt indicator of value is computed, the weighting of 25 percent which would have been applied to this indicator of value will be placed on the cost indicator of value.
Subp. 5.
Unit value computation.
The estimated unit value of the railroad property will be the total of the three weighted indicators of value. The following is an example of the computation of the unit value.
XYZ Railroad
| Valuation Approach | Value | Weighting | |
| Cost indicator of value | $27,483,000 | 15% | $ 4,122,500 |
| Income indicator of value | 21,275,000 | 60% | 12,765,000 |
| Stock and debt indicator of value | 21,300,000 | 25% | 5,325,000 |
| Unit Value $22,212,500 | |||
The weighting shown above may vary from railroad to railroad as provided for in subparts 2 to 4.
Subp. 6.
Railroads operating at a loss, bankrupt railroads involved in federal bankruptcy proceedings, and railroads adjudged bankrupt by a federal court.
Railroads which are involved in federal bankruptcy proceedings, adjudged bankrupt, or railroads having no net railway operating income will be valued using the cost and stock and debt approaches to value. If the stocks or bonds of such railroads are not traded, or do not meet the other requirements for use of the stock and debt indicator of value, then these railroads will be valued using the cost approach to value only.
History:
11 SR 335; L 1998 c 254 art 1 s 107; 28 SR 1297; L 2005 c 151 art 1 s 114
Published Electronically:
November 14, 2006
8106.0500 ALLOCATION.
Subpart 1.
In general.
After the estimated unit value of the railroad property has been determined, the portion of value which is attributable to Minnesota must be established. This is accomplished through the use of certain allocation factors. Each of the factors in the allocation method shows a relationship between the railroad system operations in all states and its Minnesota operations. These relationships are expressed in percentage figures. These percentages are then added and an average is computed. The resulting average of the factors, multiplied by the unit value, yields the Minnesota portion of the railroad property which will, after the adjustments described in parts 8106.0600 and 8106.0800, be subject to ad valorem tax in Minnesota.
Subp. 2.
Allocation factors.
The factors to be considered in making allocations of unit values to Minnesota for railroad companies are:
A.
miles of railroad track operated in Minnesota divided by miles of railroad track operated in all states;
B.
ton miles of revenue freight transported in Minnesota divided by ton miles of revenue freight transported in all states;
C.
gross revenues from transportation operations within Minnesota divided by gross revenues from transportation operations in all states; and
D.
cost of road property in Minnesota divided by the cost of road property in all states.
The following example illustrates the allocation method to be applied to the unit value of railroad property.
| XYZ Railroad | ||||
| Minnesota miles of track | 100 | |||
| Total miles of track |
.
_
500 |
= | 20% | |
| Minnesota ton miles of revenue freight | 2,200,000 | |||
| Total ton miles of revenue freight |
_
9,000,000 |
= | 24% | |
| Minnesota gross transportation revenue | $10,000,000 | |||
| Total gross transportation revenue |
_
$40,000,000 |
= | 25% | |
| Minnesota cost of road property | 2,990,000 | |||
| Total cost of road property |
_ 13,000,000 |
= | 23% | |
| Total | 92% | |||
| Minnesota Percent of Unit Value | 23% | |||
| Total Unit Value ($22,212,500 x 23%) = | ||||
| Minnesota Portion of Unit Value | $5,108,875 | |||
History:
11 SR 335; L 2005 c 151 art 1 s 114
Published Electronically:
November 14, 2006
8106.0600 ADJUSTMENTS FOR NONFORMULA ASSESSED PROPERTY OR EXEMPT PROPERTY.
After the Minnesota portion of the unit value of the railroad company is determined, property which is either exempt from taxation, such as personal property, or classified as nonoperating will be deducted from the Minnesota portion of the unit value to the extent that it has been included in the computation of this value.
Property which has been included in the computation of the unit value but has been defined as nonoperating property will be valued by the local assessor. The Minnesota portion of the unit value will be reduced by the restated cost of this property. Only nonoperating property located within Minnesota will be eligible for this exclusion.
The railroad company shall have the responsibility to submit to the commissioner of revenue, in the form required by the commissioner, such schedules of nonoperating property as the commissioner may require.
In addition to nonoperating property which will be valued and assessed locally, a deduction from the Minnesota portion of the unit value will be made for personal property.
A percentage of the Minnesota portion of the unit value before deducting nonoperating property will be excluded as personal property. This percentage will be computed in the following way:
A.
The following STB accounts for property within Minnesota will be totaled:
(8)
equipment, allocated to Minnesota on the basis of car and locomotive miles in Minnesota compared to total system car and locomotive miles.
B.
The total of these accounts will then be divided by the total of the Minnesota road, equipment, leased property, general expenditures, construction work in progress, and other elements of investment accounts. The resulting percentage will be used to determine the personal property amount of the Minnesota portion of the unit value. This amount will not be taxable for ad valorem purposes.
C.
The following is an illustration of the computation for the personal property exclusion.
XYZ Railway
| Personal Property Account | Amount in Minnesota | |
| Computer and Word Processing Equipment | $ 89,200 | |
| Coal and Ore Wharves | 100,000 | |
| Communication Equipment | 100,000 | |
| Signals and Interlockers | 200,000 | |
| Roadway Machines | 200,000 | |
| Shop Machinery | 100,000 | |
| Power Plant Machinery | 100,000 | |
| * Equipment -- Owned and Leased | 2,250,000 | |
| 3,139,200 | ||
| * Total Equipment Account | $9,000,000 | |
| Car and Locomotive Miles in Minnesota | 1,000,000 | |
| Total Car and Locomotive Miles | 4,000,000 | |
| Ratio of Minnesota to Total | 25% | |
| Minnesota Allocated Equipment Account | $2,250,000 | |
| Restated Cost Account | Amount in Minnesota | |
| Road | $2,990,000 | |
| Equipment -- Owned and Leased | 2,250,000 | |
| Construction Work in Progress | 800,000 | |
| General expenditures | 500,000 | |
| $6,540,000 | ||
| Minnesota Personal Property Accounts | $3,139,200 | |
| Minnesota Restated Cost | $6,540,000 | |
| Ratio of Personal Property to Cost | 48% | |
| Minnesota portion of unit value | 5,108,875 | |
| Personal Property exclusion at 48% | 2,452,260 | |
| Taxable Minnesota Portion of Unit Value | $2,656,615 |
History:
11 SR 335; 28 SR 1297; L 2005 c 151 art 1 s 114
Published Electronically:
November 14, 2006
8106.0700 APPORTIONMENT.
Subpart 1.
In general.
After the taxable Minnesota portion of the railroad's unit value has been determined, this value must be distributed to the various counties and taxing districts in which the railroad operates. This distribution will be accomplished by the commissioner of revenue through the use of certain apportionment components. Each of the components in the apportionment method is a reflection of the property owned or used by the railroad within a particular taxing district. The figures making up these components will be developed on information submitted by the railroad companies in annual reports filed with the commissioner, and information supplied to the commissioner by the various county auditors and assessors.
Subp. 2.
Apportionment components.
There are three components which will be used in the distribution of the value of railroad property to the various taxing districts. They are railroad operating land, miles of track, and railroad operating structures with a restated cost of $10,000 or more.
Subp. 3.
Railroad operating land.
The information for the computation of this apportionment component will be based on information submitted by both the railroads and the various county auditors and assessors. The railroad companies shall file with the commissioner of revenue each year, in conjunction with their annual reports required by part 8106.0300, subpart 1, the number of acres of railroad operating land owned or used by them in each taxing district in which they operate. The county auditor shall also be required to submit to the commissioner of revenue a report showing the number of acres of railroad operating land, detailed by owning railroad, in each taxing district within the county. If either the railroads or the auditors find that it is administratively impracticable to submit this information, the commissioner shall make an estimate of the number of acres of railroad operating land within each taxing district based on the best information available. Such information would usually consist of the miles of railroad track within the taxing district and the normal width of the right-of-way used by the railroad. In addition, information relative to the current estimated market value of all land within the respective taxing districts will be obtained from the county or city assessors by a review of the information reported to the commissioner of revenue in compliance with Minnesota Statutes, section 270C.85, subdivision 2, clause (4).
The computation for the railroad operating land apportionment component will be accomplished annually in the following manner:
A.
The average estimated market value per taxable acre within a specific taxing district will be calculated by dividing the estimated market value of all taxable land within the taxing district as indicated by the most recent assessment information reported to the commissioner under Minnesota Statutes, section 270C.85, subdivision 2, clause (4). The number of acres within a taxing district will be obtained from the most recent statistics available from the Minnesota Geospatial Information Office, Department of Administration. The total number of acres will be adjusted to allow for nontaxable or exempt acres by subtracting these nontaxable or exempt acres from the total acres. The number of nontaxable or exempt acres will be obtained from the most recent exempt real property information reported to the commissioner under Minnesota Statutes, section 270C.85, subdivision 2, clause (4). The following example illustrates this calculation.
| Estimated Market Value of All Taxable Land Within Taxing District | $200,000 | |
| Total Area of Taxing District | 210 Acres | |
| Nontaxable or Exempt Acres | 10 Acres | |
| Taxable Acres Within Taxing District | 200 | |
| _ | ||
| Average Estimated Market Value per Acre | $1,000 |
B.
This average estimated market value per taxable acre is then applied to the number of acres of railroad operating land within the taxing district to compute a gross railroad operating land component within the taxing district. The following example illustrates this computation:
| Average Estimated Market Value Per Acre | $1,000 | |
| Acres of Railroad Operating Land | x 5 | |
| _ | ||
| Gross Railroad Operating Land Component | $5,000 |
C.
This railroad operating land component will then be adjusted. This adjustment is achieved by striking a ratio between the system unit value for all Minnesota railroads, as described in part 8106.0400, subpart 5, to the total of net investment in railway property used in transportation service as defined by the STB for all railroads operating in Minnesota. This relationship will be computed annually and will then be applied to the gross railroad operating land component to arrive at the adjusted railroad operating land component. This adjusted land value will then be used as one element of the apportionment computation.
The following is an example of how the adjusted railroad operating land component is to be computed:
| Railroad | System Unit Value | Net Investment in Railway Property Used in Transportation Services | |||
| ABC Railway | $ 20,000,000 | $ 40,000,000 | |||
| FGH Railway | 5,256,000 | 8,000,000 | |||
| JKL Railroad | 2,000,000 | 4,780,830 | |||
| MNO Railroad | 50,000,000 | 90,000,000 | |||
| XYZ Railroad | 22,212,500 | 25,000,000 | |||
| _ | _ | ||||
| $ 99,468,500 | $ 165,780,830 | ||||
Total System Unit Value ($99,468,500) ÷ Total Net Investment in Railway Property Used in Transportation Services ($165,780,830) = 60%
| Gross Railroad Operating Land Component Within the Taxing District | $5,000 | |
| Adjustment Factor | 60% | |
| _ | ||
| Adjusted Railroad Operating Land Component | $3,000 |
Subp. 4.
Miles of track.
The information for the computation of this apportionment component will be based on information submitted by the railroads to the commissioner of revenue in conjunction with the annual report required by part 8106.0300, subpart 1. Each railroad will be required to list the miles of track they own in each taxing district within Minnesota. The track must be separated into two classes, main line track and all other track.
In order to make the miles of track in each taxing district compatible with the other apportionment components, the miles must be converted to dollars. This conversion will be computed annually. The conversion will be accomplished by adding together the following STB accounts for each railroad's net investment in Minnesota: account 3, grading; account 8, ties; account 9, rails; account 11, ballast. The total of these accounts will then be divided by the number of miles of track operated by the respective railroads within Minnesota to obtain a cost per mile figure. This will be used as the average cost per mile for track within Minnesota.
The following is an example of how the average cost per mile of track in Minnesota will be computed:
| Railroad | Total of Accounts #3, 8, 9, 11 |
Mileage Operated in Minnesota | |||
| ABC Railway | $ 4,000,000 | 154 | |||
| FGH Railway | 800,000 | 42 | |||
| JKL Railroad | 500,000 | 20 | |||
| MNO Railroad | 7,450,000 | 290 | |||
| XYZ Railroad | 2,500,000 | 104 | |||
| _ | _ | ||||
| $ 15,250,000 | 610 | ||||
Total cost of track ($15,250,000) ÷ Total miles operated (610) = Average Cost per Mile of Track $25,000.
Main line track shall be weighted at 1.5 times the cost of all other track; thus, if the average cost per mile of track is $25,000, main line track would be worth more than $25,000 per mile, while all other track would be worth less. The calculation for the average cost of both main line and all other track shall be made annually on an industry basis.
The calculation to determine the average cost per mile of main line track and the average cost per mile of all other track will be computed in the following manner:
A.
Total mileage operated will be multiplied by the average cost per mile to arrive at a total track cost.
B.
Total mileage operated will be separated into the two types of track, main line and all other track.
D.
Adjusted main line miles will be added to all other track miles to arrive at adjusted total track miles.
E.
Total track cost will be divided by adjusted total track miles to arrive at the cost per mile of all other track.
F.
The cost per mile of main line track will be computed by multiplying the cost per mile of all other track by 1.5.
An illustration of this computation is as follows:
| Railroad | Mileage Operated | Main Line Miles | All other Track Miles | |||
| ABC Railway | 154 | 96 | 58 | |||
| FGH Railway | 42 | 10 | 32 | |||
| JKL Railroad | 20 | 15 | 5 | |||
| MNO Railroad | 290 | 132 | 158 | |||
| XYZ Railroad | 104 | 52 | 52 | |||
| _ | _ | _ | ||||
| 610 | 305 | 305 | ||||
| Total Mileage Operated | 610 | |||
| Average Cost Per Mile of Track | $ 25,000 | |||
| Total Track Cost | $ 15,250,000 | |||
| Main Line Miles | 305 | |||
| Weighting Factor | 1.5 | |||
| Adjusted Main Line Miles | 457.5 | |||
| Other Track Miles | 305.0 | |||
| Adjusted Total Track Miles | 762.5 | |||
| Total Track Cost | $ 15,250,000 | |||
| Adjusted Total Track Miles | 762.5 | |||
| Average Cost Per Mile of Other Track | $ 20,000 | |||
| Average Cost Per Mile of Other Track | $ 20,000 | |||
| Weighting Factor | 1.5 | |||
| Average Cost Per Mile of Main Line Track | $ 30,000 | |||
After the per mile cost figures for main line and all other track are obtained, these per mile cost figures would be multiplied by the length of each type of track in a particular taxing district to obtain the value of the trackage in that district. The same cost figures will be used for all railroads operating in Minnesota.
Subp. 5.
Structures.
The information for the computation of this apportionment component will be based on statements submitted by the railroads. These schedules shall be submitted annually to the commissioner of revenue in conjunction with the annual report required by part 8106.0300, subpart 1. The schedules shall show the location, by taxing district, of all operating structures owned by the reporting railroad within Minnesota with a restated cost of $10,000 or more. The schedules shall list a description of the structure and the railroad's current restated cost investment in the structure as it appears in the appropriate STB account.
An example of this listing is as follows:
XYZ Railroad
| Taxing District | Description | Restated Cost |
| St. Paul, S.D. #625 | Office Building | $ 400,000 |
| Minneapolis, S.D. #1 | Depot | 20,000 |
| Fridley, S.D. #16 | Yard Tower | 200,000 |
| Anoka, S.D. #11 | Engine and Car Shop | 250,000 |
| _ | ||
| Total | $ 870,000 |
Subp. 6.
Apportionment computation.
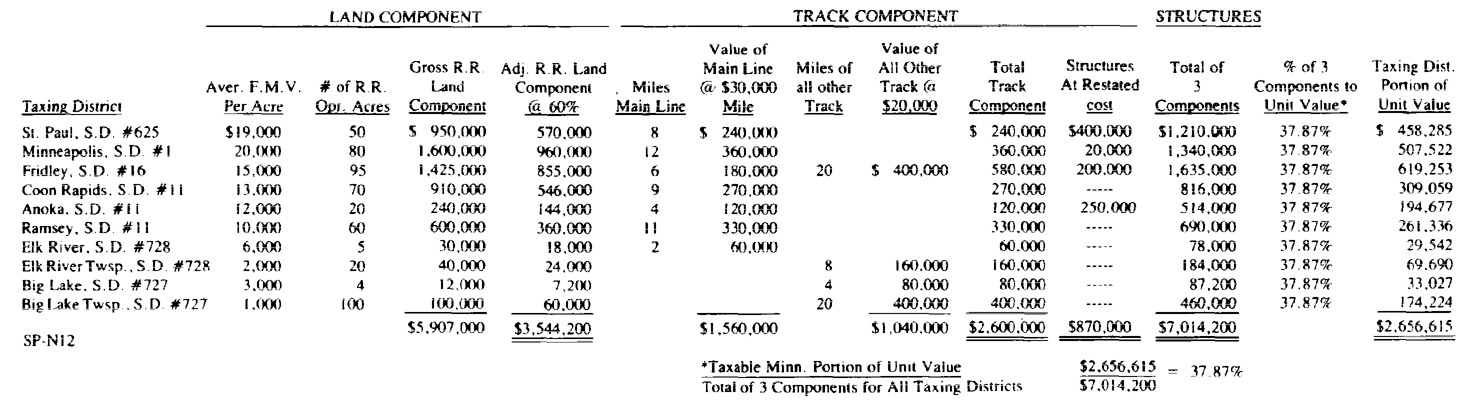
The apportionment of a railroad's taxable Minnesota value is accomplished by totaling the amount of the land, track, and structure components as developed in subparts 3 to 5 for each taxing district, then finding the sum of these totals for all the taxing districts in which the subject railroad operates. The taxable Minnesota portion of the railroad's unit value is divided by the total of the three apportionment components for all taxing districts in which the railroad operates in order to arrive at a percentage. This resulting percentage is then applied to the total amount of the three apportionment components for each specific taxing district. The figure produced by this multiplication process is the taxing district's share of the railroad's taxable Minnesota portion of the unit value. No more value can be distributed to the various taxing districts than that produced by the valuation process described in parts 8106.0100 to 8106.0600.
The example in part 8106.9900 illustrates the apportionment process.
History:
11 SR 335; 28 SR 1297; L 2005 c 151 art 1 s 114; L 2009 c 101 art 2 s 107; 44 SR 957
Published Electronically:
March 10, 2020
8106.0800 EQUALIZATION.
Subpart 1.
In general.
After the apportionment of value referred to in part 8106.0700 has been made, the railroad property values must be equalized to coincide with the assessment levels of commercial and industrial property within each respective county receiving a share of the apportioned railroad value. This equalization will be accomplished through the use of an assessment/sales ratio.
Subp. 2.
Assessment/sales ratio computation.
A comprehensive assessment/sales ratio study compiled annually by the sales ratio section of the Property Tax Division of the Department of Revenue commonly known as the State Board of Equalization Sales/Ratio Study will be used in this computation. The portions of this study which will be used for purposes of this section are known as the "County Commercial and Industrial Sales Ratio."
This commercial and industrial (C & I) sales ratio is computed through an analysis of the certificates of real estate value filed by the buyers or sellers of commercial or industrial property within each county. The information contained on these certificates of real estate value is compiled pursuant to requests, standards, and methods set forth by the Minnesota Department of Revenue acting upon recommendations of the Minnesota legislature. The most recent C & I study available will be used for purposes of this section.
The median C & I sales ratio from the County Commercial and Industrial Sales Ratio study will be used as a basis to estimate the current year C & I median ratio for each county.
The process used to estimate this current year median ratio will be as follows.
The current estimated market value of commercial and industrial property within each county will be taken from the information reported to the commissioner under Minnesota Statutes, section 270C.85, subdivision 2, clause (4). The amount of the value of new commercial and industrial construction, ("new" meaning since the last assessment period) as well as the value of commercial and industrial property which has changed classification (i.e. commercial to tax exempt property) will also be taken from the information reported to the commissioner under Minnesota Statutes, section 270C.85, subdivision 2, clause (4). The value of new construction will then be deducted from the estimated market value, resulting in a net estimated current year market value for commercial and industrial property within the county. The value of commercial and industrial property which has changed classification will be deducted from the previous years estimated market value to arrive at a net estimated previous year market value for commercial and industrial property within the county. The net current year value will be compared to the net previous year's estimated market value for commercial and industrial property within the county and the difference between the two values noted. This difference will be divided by the previous year's net estimated market value for commercial and industrial property to find the percentage of increase, or decrease, in assessment level for each year. This percent of change will be applied to the most recent C & I median ratio to estimate the current year's C & I median ratio. An example of this calculation for a typical county is shown below.
| Current Year Estimated Market Value for Commercial and Industrial Property | $12,000,000 | |
| Less: New Construction | 1,500,000 | |
| _ | ||
| Current Year Net Estimated Market Value for Commercial and Industrial Property | 10,500,000 | |
| Previous Year Estimated Market Value for Commercial and Industrial Property | 10,250,000 | |
| Less: Classification Changes | 250,000 | |
| _ | ||
| Previous Year Net Estimated Market Value for Commercial and Industrial Property | 10,000,000 | |
| _ | ||
| Difference Previous Year vs. Current Year Estimated Market Value | 500,000 | |
| Percent of Change (500,000 ÷ 10,000,000) | 5% | |
| Previous Year Median Commercial and Industrial Ratio | 88% | |
| Current Year Estimated Median Commercial and Industrial Ratio (88% x 105%) | 92.4% |
This same calculation is performed for each Minnesota county which contains operating railroad property. If there are five or fewer valid sales of commercial and industrial property within a county during the study period, these few sales are insufficient to form the basis for a meaningful C & I ratio. Therefore, the median assessment/sales ratio to be used for purposes of the above computation will not be the median C & I ratio but will be the weighted median ratio of all property classes within the county for which a sales ratio is available. This weighted median ratio is computed in the same manner using the same procedures and standards as the C & I ratio. In addition, the computation described above will not be performed using the commercial and industrial estimated market value but will use the estimated market value for all property within the county. All other aspects of the calculations are identical except for this substitution.
The weighted median ratio is developed by multiplying the median ratio for each class of property (agricultural, residential, recreational, commercial) by the percentage of value that class of property comprises of the total county value. An example of this calculation is as follows:
| Class of Property | Amount of Value | Percent of Value | Median Ratio | Weighted Median Ratio |
| Residential | $ 20,000,000 | 20% | 85% | 17.00% |
| Agricultural | 55,000,000 | 55% | 95% | 52.25% |
| Seasonal - Recreational | 5,000,000 | 5% | 90% | 4.50% |
| Commercial - Industrial | 20,000,000 | 20% | 85% | 17.00% |
| Total | $100,000,000 | 100% | 90.75% |
Subp. 3.
Application of the estimated current year median assessment/sales ratio.
After the estimated current year median ratio has been calculated pursuant to subpart 2, it is used to adjust the apportioned estimated market value of operating railroad property to the apparent assessment level of commercial and industrial property in each county. This is done by multiplying the estimated market value of the railroad property by the estimated sales ratio to arrive at the equalized market value of operating railroad property. In no instance will any adjustment be made if, after comparing the estimated current year sales ratio to the assessment level of operating railroad property, the difference between the two is five percent or less. An example of this adjustment is as follows:
| Estimated Market Value of Railroad Operating Property* | Estimated Current Year Median Sales Ratio | Equalized Estimated Market Value of Railroad Operating Property | |
| County A | $ 100,000 | 85% | $ 85,000 |
| County B | 250,000 | 88% | 220,000 |
| County C | 300,000 | 90% | 270,000 |
| County D | 150,000 | 92% | 138,000 |
| County E | 100,000 | 95% | 100,000** |
* For purposes of this example, assume that railroad property is assessed at 100 percent of market value.
** No adjustment made because estimated current year median sales ratio is within five percent of assessment level on operating railroad property.
All railroads operating within a particular county will be equalized at the same percentage.
These equalized estimated market values of operating railroad property will be certified to the county assessor denoting specific railroads and taxing districts pursuant to Minnesota Statutes, section 270.87.
History:
11 SR 335; 28 SR 1297; L 2005 c 151 art 1 s 114; 44 SR 957
Published Electronically:
March 10, 2020
8106.9900 EXAMPLE OF APPORTIONMENT PROCESS.
History:
11 SR 335; L 2005 c 151 art 1 s 114
Published Electronically:
November 14, 2006
Official Publication of the State of Minnesota
Revisor of Statutes